4. Results
This section provides an accurate and concise description of the data collected. Tables and figures are used for better summarizing the research findings about the emerging patterns and trends of the development of Chinese academic libraries. Five perspectives are adopted in describing the fundamental service capability of Chinese academic libraries in 2023. These five perspectives include library operations fund and document resources purchase fee, library building acreage, library director characteristics, use of positioned librarians, document resources collection and utilization. Each perspective has several sub-indicators.
4.1. Operations Fund and Document Resources Purchase Fee
There are 1,224 academic libraries that have submitted their operations fund data for 2023. The mean of the operation fund per university library is at RMB 6.64 millions. In comparison with the mean fund of RMB 6.192 millions in 2022, this represents an increase of RMB 0.448 million over 2022, with a growth rate of 7.2%. The total operations fund for all Chinese academic libraries is approximately at RMB 20.411 billions based on the estimated mean in the 95% confidence interval [RMB 18.640 billions, RMB 22.182 billions]. The median is at RMB 3.292 millions (RMB 3.233 millions in 2022). This shows an increase of RMB 0.059 million over 2022. The mode is at RMB 3.6 millions, and the standard deviation is at RMB 10.289 millions (RMB 8.907 millions in 2022). The standard error of the mean is at RMB 0.294 million. The range is at RMB 130.752 millions (73.781 millions in 2022).
The data analysis above reveals that the operations fund of Chinese academic libraries in 2023 is increased significantly compared with that in 2022. It shows that the inter-library operations fund gap is further widened compared with that in previous years.
Table 1 presents the distribution of the operations fund at several intervals. It reveals that almost half of the Chinese academic libraries have the total operations fund at the interval between RMB 2 millions and RMB 10 millions.
A rank analysis is conducted on the operations fund in 2023. It finds that the top 5 Chinese academic libraries are all from the "Double First-Class" universities in developed metropolitan areas with special policy support. These top 5 libraries include Sun Yat-sen University Library at Guangzhou with RMB 130.788 millions, Peking University Library at the Chinese capital with RMB 96.274 millions, Peking Union Medical College Library in Beijing with RMB 81.914 millions, Wuhan University Library at Wuhan with 80.184 millions, Shanghai Jiao Tong University Library in Shanghai municipality with RMB 74.36 millions. The bottom five Chinese academic libraries are from young vocational colleges including Tianjin Vocational College of Land Resources and Housing Library in Tianjin municipality with RMB 68.414 thousands, Jiangxi Vocational College of Art Library in Jiangxi province with RMB 64 thousands, Hulunbuir Vocational and Technical College Library in Chinese Inner Mongolia autonomous region with RMB 58.307 thousands, Beijing Vocational College of Economics and Technology Library in Hebei province with RMB 37.097 thousands, Shangrao Preschool Education College Library in Jiangxi province with 36.673 thousands.
Table 1. Distribution of the operations fund of Chinese academic libraries from 2018 to 2023.
Total Fund (RMB 10,000) | 2018 | 2019 | 2020 | 2021 | 2022 | 2023 |
<10 | 1.5 | 1.6 | 2.4 | 1.7 | 1.3 | 0.7 |
10-49.99 | 5.3 | 6.8 | 6.4 | 5.8 | 5.4 | 4.5 |
50-99.99 | 10.9 | 10.4 | 9.4 | 10 | 10.3 | 9.6 |
100-149.99 | 9.8 | 10.4 | 8.8 | 8.6 | 8.3 | 8.6 |
150-199.99 | 8.1 | 7.7 | 8.1 | 9.8 | 7.8 | 7.6 |
200-499.99 | 28.7 | 29.6 | 31 | 30.7 | 32.7 | 33.7 |
500-999.99 | 17.1 | 17.6 | 16.3 | 17.9 | 17.9 | 17.9 |
1000-1999.9 | 12.1 | 10.5 | 11.4 | 9.6 | 9.8 | 10.2 |
2000 and above | 6.5 | 5.4 | 6.2 | 5.9 | 6.5 | 7.2 |
*All the annual data use % as unit and are 100%.
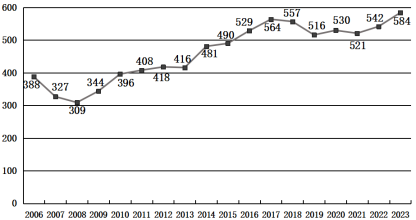
There are 1,224 Chinese academic libraries that have submitted valid document resources purchase fee data in 2023. The mean of this purchase fee across all academic libraries is at approximately RMB 5.839 millions (RMB 5.423 millions in 2022). This represents an increase of RMB 416,000 from 2022 with a growth rate of 7.7%, reaching a historical high level.
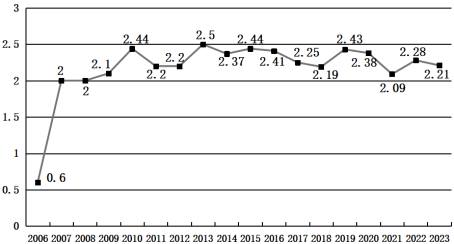
Figure 1 presents an overview of the growth trend.
Based on the estimated mean, the document resources purchase fee of Chinese academic libraries is approximately at RMB 17.949 billions (95% confidence interval [RMB 16.370 billions, RMB 19.528 billions]). The median is at RMB 2.875 millions (RMB 2.797 millions in 2022), an increase of RMB 78,000 from 2022. The mode is at RMB 3 millions (RMB 2 millions in 2022), the standard deviation is at RMB 9.153 millions (RMB 7.856 millions in 2022), and the standard error of the mean is at RMB 262,000. All these results show that there is an increasing trend in the document resources purchase fee in the development of Chinese academic libraries. A further examination of these data reveals that the gap between different academic libraries with respect to the document purchase fee is becoming wider.
Figure 1. The emerging trend of document resources purchase fee from 2006 to 2023 (10,000 RMB).
A rank analysis reveals the top five academic libraries and the bottom five academic libraries with respect to the document purchase fee in 2023. The top 5 academic libraries include Sun Yat-sen Sun Yat-sen University Library with RMB 119.968 millions (RMB 52.034 millions in 2022), Peking Union Medical College Library with RMB 74.416 millions (RMB 71.736 millions in 2022), Peking University Library with RMB 73.939 millions (RMB 48.309 millions in 2022), Tsinghua University Library with RMB 69.22 millions (RMB 72.646 millions in 2022), Shanghai Jiaotong University Library with RMB 67.259 millions (RMB 63.331 millions in 2022). The bottom five academic libraries consist of Songyuan Vocational and Technical College Library with RMB 46.856 thousands (RMB 711 thousands in 2022), Beijing Vocational College of Economics and Technology Library with RMB 37.097 thousands (missing in 2022), Shangrao Preschool Education College Library with RMB 21.173 thousands (RMB 167.8 thousands in 2022), Jilin Vocational College of Science and Technology Library with RMB 10 thousands (RMB 210 thousands in 2022), Guangdong Vocational College of Arts and Sciences Library with RMB 6.2 thousands (RMB 76.998 thousands in 2022).
4.1.1. Paper Document Resources Purchase Fee
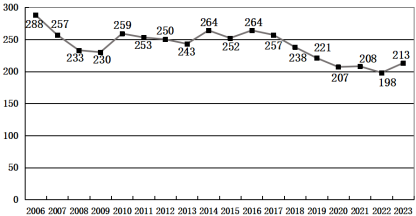
There are 1,230 academic libraries that have submitted valid paper document resources purchase fee data for 2023. The mean of the paper document resources purchase fee is at about RMB 2.126 millions (RMB 1.981 millions in 2022). This represents an increase of RMB 0.145 million compared with that in 2022, with a growth rate of 7.3%. The total paper resources purchase fee of all Chinese academic libraries is at about RMB 6.535 billions (95% confidence interval [RMB 5.932 billions, RMB 7.138 billions]).
Figure 2 presents an overview of the distribution of the mean of the paper document resources purchase fee. It displays a trend of stopping the decline and recovering in the recent years.
An examination of these statistical data reveals that there is little increase over the years with respect to the paper document resources purchase fee in each academic library. The median of the paper document resources purchase fee is at RMB 1.45 millions (RMB 1.446 millions in 2022). The mode is at RMB 1 million (RMB 1.5 millions in 2022). The standard deviation is at RMB 3.519 millions (RMB 2.248 millions in 2022), and the standard error of the mean is at RMB 100,000. All the results show that the gap of the paper document resources purchase fee among Chinese academic libraries is becoming wider than before.
Figure 2. The emerging trend of paper document resources purchase fee from 2006 to 2023 (10,000 RMB).
A rank analysis is conducted with respect to the paper document resources purchase fee across all the libraries examined. This leads to the identification of the top five and the bottom five academic libraries in this regard. The top five Chinese academic libraries are Sun Yat-sen University Library with RMB 70.02 millions (RMB 23.62 millions in 2022), Peking Union Medical College Library with RMB 58.435 millions (RMB 71.736 millions in 2022), Central South University Library with RMB 40.091 millions (RMB 28.9 millions in 2022), Beijing Normal University Library with RMB 26.574 millions (RMB 24.886 millions in 2022), and Peking University Library with RMB 23.924 millions (RMB 26.775 millions in 2022). The bottom five Chinese academic libraries are Wuhan University of Engineering Science Library with RMB 12.701 thousands (RMB 1594.149 thousands in 2022), Jilin Science and Technology Vocational College Library with RMB 10 thousands (60 thousands in 2022), Changchun University Library with RMB 7.966 thousands (missing in 2022), Nankai University Binhai College Library with RMB 7.616 thousands (missing in 2022), and Guangdong Institute of Arts and Sciences Library with RMB 6.2 thousands (76.998 thousands in 2022).
4.1.2. Electronic Resources Purchase Fee
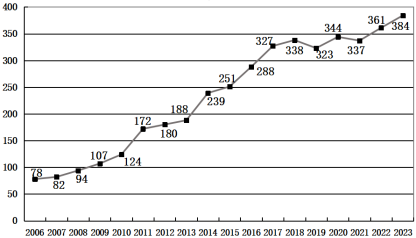
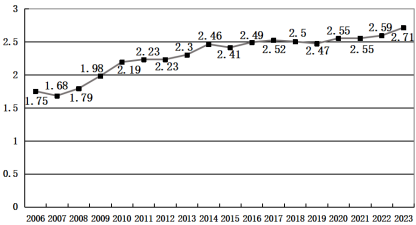
There are 1,190 Chinese academic libraries that have submitted valid electronic resources purchase fee data for 2023. The mean of the electronic resources purchase fee is at RMB 3.842 millions (RMB 3.609 millions in 2022). This accounts for 65.8% of the mean document resources purchase fee per library (66.5% in 2022), reaching at a historical high level. The total of the electronic resources purchase fee for Chinese academic libraries is at RMB 11.81 billions (95% confidence interval [RMB 10.641 billions, RMB 12.979 billions]).
With respect to the document resources purchase fee, the proportion of the electronic resources purchase fee has exceeded 60%. The mean of the electronic resources purchase fee has steadily been being on an upward trend since 2006, only falling back in 2019, as shown in
Figure 3. The median is at RMB 1.093 millions (RMB 1.122 millions in 2022), which is RMB 29,000 lower than that in 2022. The standard deviation is at RMB 6.701 millions. The standard error of the mean is at RMB 194,000. The minimum amount of the electronic resources purchase fee is only at RMB 5,000. The maximum is at RMB 54.447 millions. These results show that there is a quite degree of dispersion in the electronic resources acquisition fee in Chinese academic libraries and the inter-library differences in this regard are obvious great with the emerging widening gap.
A rank analysis is conducted with respect to the electronic resources purchase fee. As a result, the top five Chinese academic libraries are identified as Shanghai Jiao Tong University Library, RMB 54.447 millions (RMB 50.547 millions in 2022), Zhejiang University Library, RMB 51.296 millions (RMB 46.719 millions in 2022), Tsinghua University Library, RMB 50.315 millions (RMB 54.810 millions in 2022), Sun Yat-sen University Library, RMB 49.948 millions (RMB 28.413 millions in 2022), and Peking University Library, RMB 49.860 millions (RMB 25.05 millions in 2022). The bottom five Chinese academic libraries in this regard are Guangyuan China Nuclear Vocational and Technical College Library, RMB 19 thousands (RMB 19 thousands in 2022), Anhui Electrical Engineering Professional Technique College Library, RMB 14.99 thousands (RMB 159.75 thousands in 2022), Wuhu University Library, RMB 10 thousands (RMB 10 thousands in 2022), Lijiang Culture and Tourism College Library, RMB 7 thousands (RMB 25 thousands in 2022), and Daxinganling Vocational College Library, RMB 5 thousands (RMB 5 thousands in 2022).
Figure 3. The emerging trend of the electronic resources purchase fee from 2006 to 2023 (10,000 RMB).
4.2. Library Building Acreage
4.2.1. Total Library Building Acreage
There are 1,250 Chinese academic libraries that have submitted valid data for the library building acreage in 2023. The mean value is at 27,100 square meters. This represents an upward trend compared with 25,900 square meters in 2022. The total library building acreage of Chinese universities is at about 88.305 million square meters (95% confidence interval [84.853 million square meters, 91.758 million square meters]).
Chinese academic libraries tend to build bigger and wider acreage of library buildings than before. The standard error of the mean is at 573 square meters, and the standard deviation is at 20,300 square meters, which is slightly higher than 19,400 square meters in 2022, indicating that Chinese university library building acreage continues to grow. It is, however, worthwhile to note that the difference between academic libraries in this regard is continuing to increase. The median is at 23,000 square meters (22,000 square meters in 2022), and the mode is at 20,000 square meters. Most Chinese universities tend to build their libraries more than 20,000 square meters.
Figure 4. The emerging trend of the library building acreage from 2006 to 2023 (10,000 meters).
The change trend of the mean building acreage of academic libraries from 2007 to 2010 and from 2012 to 2014 is examined. The result shows a slightly steep curve growth trend in the first few years. From 2011 to 2012, this growth trend is then slowed.
Figure 4 presents the emerging trend in this regard.
A rank analysis is carried out on the library building acreage. The top five Chinese academic libraries are identified as Sun Yat-sen University Library, 179,700 square meters (114,000 square meters in 2022), Shandong University Library, 135,600 square meters (136,400 square meters in 2022), Zhejiang University Library, 128,700 square meters (92,200 square meters in 2022), Sichuan University of Science and Chemical Technology Library, 115,900 square meters (115,900 square meters in 2022), and South China Normal University Library, 111,000 square meters (111,000 square meters in 2022). The bottom five Chinese academic libraries are Quanzhou Textile Garment Institute Library, 800 square meters (800 square meters in 2022), Changchun Institute of Education Library, 759 square meters (759 square meters in 2022), Changchun Open University Library, 600 square meters (600 square meters in 2022), Tianjin City Vocational College Library, 500 square meters (missing in 2022), and Library of the Open University of Jilin, 359.1 square meters (359.1 square meters in 2022).
4.2.2. Total New Library Building Acreage Under Construction
There are 179 academic libraries that have submitted valid data on the construction of new library building in 2023, with a total of 3.954 million square meters (3.945 million square meters in 2022, with 173 libraries submitting data). The mean is at 22,100 square meters (22,800 square meters in 2022), the standard deviation is at 16,200 square meters, the mode is at 20,000 square meters, and the median is at 20,000 square meters. An analysis of such data reveals that more and more academic libraries tend to build new buildings with 20,000 square meters or more.
The acreage of new library building under construction varies greatly in different academic libraries. For example, the library of Fujian University of Traditional Chinese Medicine, which ranks last, has an under-construction new library building acreage of 361 square meters. The library in the university of Hebei Foreign Language, which ranks the first, has an under-construction new library building acreage of 69,225.6 square meters, which is almost 192 times compared with the former. Since 2006, the mean of under-construction new library building acreage has fluctuated in a wave-like manner between 21,000 and 25,000 square meters.
Figure 5 presents the distribution of the mean of new library building acreage.
Figure 5. An overview of the new library building acreage under construction from 2006 to 2023 (10,000 meters).
4.3. Library Directors
This section analyzes the library directors and their professional titles in the development of academic libraries. To make a full use of the data for discovering the emerging patterns and trends on Chinese academic library directors, all the sub-indicator data are utilized in the analysis.
4.3.1. Basic Analysis of Library Directors
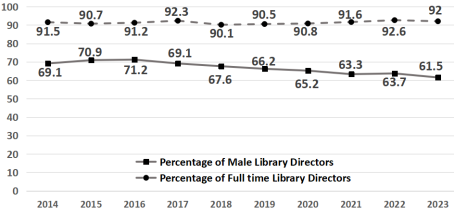
There are 1,235 academic libraries that have submitted valid data on the gender and positioned working types of directors in 2023. In terms of gender, male directors account for 61.5%. This shows a trend of decrease comparing with previous years. In terms of positioned working types of directors, full-time directors account for 92%. The proportion of full-time directors in the past three years is relatively close.
Figure 6 presents an overview of the results above.
There are 1,227 libraries that have submitted valid background data of library directors in 2023. An analysis of such data finds that 81.6% of library directors have non-library science background. From 2014 to 2022, the proportion of non-library science background respectively was at 74.8%, 74.5%, 76.7%, 76.8%, 78.4%, 79.1%, 80.4%, 79.8%, 80.1%. The proportion of librarians with non-library science background has almost reached 80% for three years since 2020.
Figure 6. The emerging trend of library directors in gender and full-time work from 2014 to 2023 (%).
4.3.2. Library Directors’ Professional Title and Education
Library directors with senior professional titles account for the highest proportion of the total although still less than half. This shows a downward trend before 2021 and an upward trend after that year. From 2014 to 2023, the proportion of library directors with senior professional titles in each year was: 57.2%, 56.5%, 54.2%, 55.3%, 52.4%, 48.3%, 48.4%, 45.9%, 47.2%, 48.4%. Library directors with associate senior professional titles rank the second. Their proportion shows a trend of rising before 2021 and then falling after that year. From 2014 to 2023, the proportion of library directors with associate senior professional titles in each year were: 33.4%, 33.8%, 35.2%, 32.5%, 34.9%, 37.4%, 37.3%, 38.4%, 36.7%, 35.5%.
Library directors with intermediate professional titles are ranked in the third place. Their proportion keeps rising slowly. From 2014 to 2023, the proportion of library directors with intermediate professional titles are: 7.4%, 7.1%, 8.6%, 9.2%, 9%, 10.9%, 10.9%, 11.7%, 12.1%, 12%. Library directors without or under intermediate professional titles have a slowly rising trend. From 2014 to 2023, the proportion of them in each year were: 2%, 2.7%, 2%, 3%, 3.7%, 3.4%, 3.4%, 4%, 4%, 4%.
A chi-square test is conducted in examining the relationship between types of universities and professional titles of library directors. The Pearson chi-square value is at 178.401 (p<0.05), the likelihood ratio is at 192.332 (p<0.05), and the dependence coefficient is at 0.357 (p<0.05). This shows that there is a significant correlation between professional titles and types of academic libraries. The “Double First-Class” academic libraries tend to hire more senior professional library directors than other academic libraries. The three years college libraries tend to hire more associate senior professional library directors than others. These results are consistent with the observation trend in
Table 2.
The proportion of library directors with senior professional titles is consistent with the type of universities to which they belong. In 2023, the proportion of library directors with senior professional titles in the libraries of "Double First-Class" universities exceeds 80%, and the proportion of library directors with senior professional titles in the libraries of common universities exceeds 50%. The proportion of library directors with senior professional titles in the library of three-year colleges is only at 25.4%. The proportion of library directors with associate senior professional titles shows an obvious sequential and hierarchical change with their university types. The proportion of library directors with associate senior professional titles in three-year colleges exceeds 50%, while that of the "Double First-Class" universities is only at 13.1%.
The proportion of library directors with postgraduate degrees has generally shown an upward trend. In terms of the academic degree of library directors, from 2014 to 2023, the proportion of library directors with the doctoral degree is at 21.4%, 21.6%, 21.8%, 22.8%, 22.2%, 18.9%, 19.9%, 20%, 21.5%, 23.2% respectively. The proportion of library directors with the master degree is at 30%, 31.6%, 31.1%, 31.6%, 31.7%, 31.5%, 34.5%, 36.2%, 38.8%, 39.2% respectively. Furthermore, the proportion of library directors with the bachelor’s degree or below has been generally decreasing over the years. This is because the faculty recruiting threshold is raising, with a master’s degree or above becoming a prerequisite. From 2014 to 2023, the proportion of library directors with bachelor’s degree is at 46.3%, 44.7%, 45.6%, 44.3%, 44.9%, 48.7%, 44.9%, 42.7%, 38.9%, 36.8% respectively. The proportion of library directors under bachelor’s degree is at 2.3%, 2.1%, 1.6%, 1.3%, 1.3%, 0.8%, 0.7%, 1.1%, 0.8%, 0.8%.
Table 2. A cross-table analysis of professional titles of university library directors in 2023 (Unit: Person and %).
Type of Academic Library | Professional Title of Library Directors | Total |
Others | Intermediate | Associate Senior | Senior |
Three years College | 29 (6.6) | 80 (18.1) | 220 (49.9) | 112 (25.4) | 441 |
Common University | 17 (2.6) | 66 (10.0) | 198 (30.1) | 377 (57.3) | 658 |
Double First-class | 3 (2.5) | 1 (0.8) | 16 (13.1) | 102 (83.6) | 122 |
Total | 49 (4.0) | 147 (12) | 434 (35.6) | 591 (48.4) | 1221 |
*There are 102 missing values in these data.
The postgraduate education in China has been expanded rapidly in recent years. As a result, many library directors have taken the part-time study opportunity to upgrade their qualifications. This leads to a significant change of the qualifications of library directors.
Table 3 presents an overview of the correlation between the type of universities and the educational qualification of library directors.
Table 3. An overview of the correlation between the type of universities and the education qualification of library directors in 2023 (Unit: Person and %).
Directors’ Academic Education Level | Doctoral | Master | Bachelor | Under Bachelor | Total |
Three years College | 15 (3.4) | 186 (42.4) | 230 (52.4) | 8 (1.8) | 439 |
Common University | 176 (26.4) | 275 (41.3) | 213 (32.0) | 2 (0.3) | 666 |
Double First-class | 94 (77.0) | 20 (16.4) | 8 (6.6) | 0 | 122 |
Total | 285 (23.2) | 481 (39.2) | 451 (36.8) | 10 (0.8) | 1227 |
*There are 96 missing values in these data.
A chi-square test is conducted for examining the relationship between the type of universities and their library directors’ education qualifications. The statistical analysis result shows that there is a significant correlation. The Pearson chi-square is at 319.539 (p<0.05), the likelihood ratio is at 321.028 (p<0.05), and the dependence coefficient is at 0.455 (p<0.05).
Most library directors in “Double First-Class” universities have doctoral degrees. A high proportion of library directors in common universities have master’s degree. It is worthwhile to note that library directors in Chinese three-year colleges still mainly have undergraduate education. The academic qualification of this group of library directors, however, has been improving, with the proportion of library directors with master’s degree has reached at 42.4%.
4.3.3. Popular Qualifications of Library Directors
There is a significant correlation between library directors’ education levels and their professional titles.
Table 4 presents the result.
Table 4. An overview of the correlation between professional titles and education levels of library directors in 2023 (Unit: Person and %).
Professional Titles | Library Directors’ Education Level | Total |
Doctoral | Master | Bachelor | Under Bachelor |
Senior | 251 (20.6) | 204 (16.8) | 133 (10.9) | 1 (0.1) | 589 |
Associate Senior | 23 (1.9) | 202 (16.6) | 205 (16.9) | 1 (0.1) | 431 |
Intermediate | 4 (0.4) | 61 (5.0) | 78 (6.4) | 3 (0.3) | 146 |
Others | 1 (0.1) | 11 (0.9) | 31 (2.5) | 5 (0.5) | 48 |
Total | 279 | 478 | 447 | 10 | 1214 |
*There are 109 academic libraries that do not have data on their directors’ titles or academic degrees.
The type of universities has a significant correlation with the education level of their library directors. A chi-square test is conducted on the relationship between library directors’ professional titles and their education levels. The Pearson chi-square value is at 333.481 (p<0.05), the likelihood ratio is at 327.367 (p<0.05), the dependence coefficient is at 0.464 (p<0.05). In 2023, the proportion of library directors with doctoral degree could be the highest at 20.6%. The vice directors with bachelor’s degree are ranked second, accounting for 16.9%. Library directors with master’s degree and senior professional titles are in third, accounting for 16.8%. Generally, both education levels and professional titles are the important factors in selecting university library directors.
4.4. Library Human Resources
The human resources of academic libraries mainly include positioned librarians, contracted staff, temporary workers, and part-time students. To make a full use of the data of library human resources, all the available data have been analyzed.
4.4.1. Total Number of Positioned Librarians
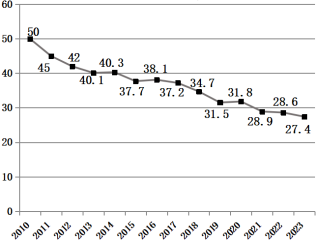
There are 1,301 academic libraries that have submitted valid data on the total number of positioned librarians in 2023. It reveals that there is an average of 27.4 librarians per library (28.6 librarians in 2022). This means that the total number of positioned librarians per university library continues to decrease. The total number of positioned librarians in Chinese academic libraries is at about 84,105 librarians (95% confidence interval [79,887, 88,323]). The median of positioned librarians is at 19 librarians (20 in 2022), the mode falls between 10 and 11, the standard error of the mean is at 0.7, and the standard deviation is at 25.7 (27.7 in 2022), which is more convergent than that in the previous years. All data show that the number of positioned librarians in Chinese academic libraries varies greatly, and the mean, median and mode of positioned librarians per library have decreased significantly compared with those in previous years.
Figure 7 presents the annual change trend of the mean of positioned librarians per library. The library with the largest number of positioned librarians is Jilin University Library, with 267 librarians in comparison with 302 librarians in 2022, a decrease of 35 librarians from the previous year. There are 6 academic libraries with zero positioned librarians which are private universities or Sino-foreign cooperatively run ones.
Figure 7. The emerging trend of the positioned librarian from 2010 to 2023 (Person).
Positioned librarians in Chinese top five academic libraries are still in a decrease trend. The top five universities regarding the total number of positioned librarians are Jilin University Library with 267 positioned librarians (309 in 2022), Sun Yat-sen University Library with 199 positioned librarians (205 in 2022), Peking University Library with 186 positioned librarians (190 in 2022), Shanghai Jiaotong University Library with 181 positioned librarians (194 in 2022), and Shandong University Library with 180 positioned librarians (195 in 2022).
4.4.2. Gender Distribution of Positioned Librarians
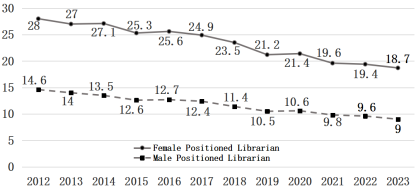
There are 1,287 academic libraries that have submitted valid data on the gender of positioned librarians. An analysis of the collected data reveals that male librarians account for 32.6% of the total positioned librarians. This represents a decrease trend from 33.1% in 2022. The mean is at 9 (9.6 in 2022). There are about 27,666 male librarians in all Chinese academic libraries (95% confidence interval [26,220, 29,112]). The median is at 7 (7 in 2022), the mode is at 3 (3 in 2022), the standard error of the mean is at 0.24, and the standard deviation is at 8.6 librarians (9.5 librarians in 2022). The total number of male librarians has generally shown a decreasing trend. The rate of decline is faster than that of female librarians.
In 2023, the total number of female librarians in Chinese academic libraries is about 57,484 (95% confidence interval [54,411, 60,557]), with the mean of 18.7 (19.4 in 2022), showing a trend of continuous decrease. The median is at 13 (13 in 2022), the mode is at 4 and 8 (7 in 2022), the standard error of the mean is at 0.51, and the standard deviation is at 18.1 (19.1 in 2022). All these data show that the number of female librarians is continuously decreasing. However, it is noticeable that the differences between academic libraries on the number of female librarians are smaller than those in previous years.
Figure 8 presents an overview of the distribution of the mean of the male and the female librarians in Chinese academic libraries from 2012 to 2023. It shows that the total number of male and female librarians continues to decrease, and the gender ratio, however, keeps stable in a range.
Figure 8. The emerging trend of the mean of the gender of positioned librarian from 2012 to 2023 (Person).
4.4.3. Education Qualification of Positioned Librarians
There are 1,269 academic libraries that have submitted valid data on the total number of positioned librarians with doctoral degree. Among them, there are 462 academic libraries that have positioned librarians with doctoral degree, accounting for 36.4% of the total number of academic libraries (35.8% in 2022). The number of positioned librarians with doctoral degree in submitted valid data academic libraries are 1,633 (1,635 in 2022, 1,532 in 2021, 1,383 in 2020, 1,294 in 2019, 1,135 in 2018, 870 in 2017, 834 in 2016, and 695 in 2015), accounting for 4.6% of the total number of positioned librarians in Chinese academic libraries (4.3% in 2022).
The ratio of the positioned librarians with doctoral degree in Chinese academic libraries is in a slowly rising trend. According to the mean and the inferential statistical analysis, there are about 3,966 positioned librarians with doctoral degree in Chinese academic libraries (95% confidence interval [3,453, 4,479]).
In general, each Chinese university library who has submitted valid data has 1.29 positioned librarians with doctoral degree (0.95 in 2015, 0.97 in 2016, 1.07 in 2017, 1.09 in 2018, 0.99 in 2019, 1.12 in 2020, 1.15 in 2021, and 1.25 in 2022). The standard error of the mean is at 0.085, the median and mode are at 0, and the standard deviation is at 3.02 (2.96 in 2022). This indicates that the differences between libraries on the positioned librarians with a doctoral degree are increasing.
Academic libraries without positioned librarians with a doctoral degree are accounting for 63.6% in 2023 (64.6% in 2018, 67.6% in 2019, 65.4% in 2020, 65.5% in 2021, and 64.2% in 2022). This represents a decreasing trend. Almost 14.5% of academic libraries have only one PhD (14.6% in 2022), 7.2% have 2 PhDs (7% in 2022), 6.5% have 3-4 PhDs (6.2% in 2022), and 8.2% have 5 or more PhDs (5.6% in 2019, 6.7% in 2020, 7.3% in 2021, and 7.9% in 2022). These data show that the proportion of academic libraries with doctoral positioned libraries is increasing, and some academic libraries are becoming more and more attractive to job applicants with doctoral degree. This shows the trend of a concentration of job applicants with doctoral degree in Chinese “Double First-Class” academic libraries.
There are 1,269 academic libraries that have submitted valid data on their positioned librarians with master’s degree. There are 93 academic libraries without positioned librarians with master’s degree. In those libraries that have submitted valid data, there are 13,671 positioned librarians with master’s degree (13,720 in 2022), accounting for 38.5% of the total positioned librarians in academic libraries (35.7% in 2022).
The mean of the positioned librarians with master’s degree is 10.8 librarians in 2023 (9.9 in 2015, 10.1 in 2016, 10.3 in 2017, 10.4 in 2018, 9.8 in 2019, 10.5 in 2020, 10.2 in 2021, and 10.5 in 2022). The median, mode, standard deviation and the standard error of the mean are at 6, 1, 13.3 and 0.37 respectively. According to the mean per library, there are about 33,200 positioned librarians with master’s degree in all Chinese academic libraries (95% confidence interval [30,970, 35,430]). Such librarians are becoming the main group of human resources in university academic libraries.
There are 1,269 academic libraries that have submitted valid data on the number of positioned librarians with bachelor’s degree. It reveals that there are a total of 16,648 librarians with bachelor’s degree (18,369 in 2022), accounting for 46.9% of the total positioned librarians. The number of positioned librarians with bachelor’s degree is 1.22 times of the total positioned librarians with master’s degree (1.87 times in 2015, 1.85 times in 2016, 1.76 times in 2017, 1.68 times in 2018, 1.63 times in 2019, 1.52 times in 2020, 1.42 times in 2021, and 1.34 times in 2022). Positioned librarians with bachelor’s degree are in a declining trend.
Each university library may have 13.1 positioned librarians with bachelor’s degree (18.8 in 2016, 18.2 in 2017, 17.4 in 2018, 16 in 2019, 16.1 in 2020, 14.6 in 2021, and 14.1 in 2022), with a median of 10, a mode of 6, a standard deviation of 11.4, and a standard error of the mean of 0.32. According to the mean, there are about 40,270 positioned librarians with bachelor’s degree in Chinese academic libraries (95% confidence interval [38,342, 42,198]). Positioned librarians with bachelor’s degree are still the main group in providing services in Chinese academic libraries.
Among the Chinese academic libraries that have submitted valid data, 19 (16 in 2022) of them did not employ any positioned librarians with bachelor’s degree, accounting for 1.5% (1.2% in 2022). Among them, 50.4% employed 1-10 positioned librarians (47.4% in 2022), 29.7% employed 11-20 positioned librarians (30% in 2022), 10.8% employed 21-30 positioned librarians (12.4% in 2022), 6.3% employed 31-50 positioned librarians (7.5% in 2022), and 1.3% employed more than 50 positioned librarians (1.5% in 2022). The proportion of academic libraries that employ 11 or more positioned librarians with bachelor’s degree is on a downward trend. Combined with the upward trend in the number of positioned librarians with master’s degree, it can be seen that academic libraries’ positioned librarians are in a period of handing over the baton from bachelor librarians to master librarians.
There are 1,269 academic libraries that have submitted valid data on positioned librarians with three years college education, with a total of 2,578 librarians (3,312 in 2022). On average, each university library employs 2 staff with college education, with a median of 1, a mode of 0, a standard deviation of 2.7, and a standard error of 0.08. According to the mean, there are about 6,148 positioned librarians with college education in Chinese academic libraries (95% confidence interval [5,666, 6,630]), and positioned librarians with college education only account for a small proportion of positioned librarians in Chinese academic libraries.
There are 453 academic libraries that do not employ positioned librarians with three years college education (415 in 2022), accounting for 35.7% (31.8% in 2022), 35.3% employ 1-2 positioned librarians (34.6% in 2022), 24.8% employ 3-7 positioned librarians (26.3% in 2022), 3.8% employ 8-15 positioned librarians (5.9% in 2022), and only 0.4% employ more than 15 positioned librarians with college education (1.4% in 2022).
There are 1,268 academic libraries that have submitted valid data on positioned librarians under three years college education, with a mean of 0.63, a median of 0, a mode of 0, a standard deviation of 1.53, and a standard error of the mean of 0.043. According to the mean, there are about 1,937 positioned librarians under three years college education in Chinese academic libraries (95% confidence interval [1,678, 2,196]). They represent only a very small proportion of positioned librarians in Chinese academic libraries, and this proportion continues to decline. There are 896 academic libraries (877 in 2022), accounting for 70.7% (67.3% in 2022) without any positioned librarians under three years college education, 27.8% employ 1-5 librarians, which is a significant decrease compared with 30.6% in 2022, 32.1% in 2021, 35.1% in 2020, 37.9% in 2019, 54.3% in 2018, and 45% in 2017.
4.4.4. Age Distribution of Positioned Librarians
There are 1,273 Chinese academic libraries that have submitted valid data on the total number of positioned librarians aged 29 and younger, of which 727 academic libraries have no positioned librarians under the age of 29, accounting for 57.1% of the total (55.7% in 2022). The number of positioned librarians aged 29 and younger in Chinese academic libraries accounts for 3.8% of the total (3.7% in 2022). Each Chinese academic library has 1.05 positioned librarians under the age of 29 and younger (1.07 in 2022), the median and mode are both at 0, the standard deviation is at 1.98, and the standard error of the mean is at 0.06. Overall, there are approximately 3,228 positioned librarians aged 29 and younger in Chinese academic libraries (95% confidence interval [2,866, 3,590]), and the proportion is decreasing compared with that in previous years. This indicates that the number of newly hired young librarians in academic libraries is decreasing year by year.
There are 1,273 Chinese academic libraries that have submitted valid data on the total number of positioned librarians aged 30-39, of which 12.3% (10.2% in 2022) of them have no positioned librarians aged 30-39. According to the mean, there are about 15,985 positioned librarians aged 30-39 in Chinese academic libraries (95% confidence interval [14,840, 17,130]). The proportion of positioned librarians aged 30-39 is at 19% (19.9% in 2022) of the total. The mean of positioned librarians aged 30-39 is at 5.2 (5.8 in 2022), the median is at 3, the mode is at 2, the standard deviation is at 6.7, and the standard error of the mean is at 0.19. The analysis of the data reveals a decreasing trend of the positioned librarians aged 30-39. This means that there are shrinking recruitments at positioned librarians for several years.
There are 1,273 Chinese academic libraries that have submitted valid data on the total number of positioned librarians aged 40-49, of which 5.5% have no positioned librarians aged 40-49. This shows that positioned librarians are aging quickly. The proportion of positioned librarians aged 40-49 is at 37.7% (36.3% in 2022). The mean of positioned librarians aged 40-49 is at 10.4 (10.6 in 2022), the median is at 7, the mode is at 2, the standard deviation is at 10.4, and the standard error of the mean is at 0.29. There are about 31,970 positioned librarians aged 40-49 in Chinese academic libraries (95% confidence interval [30,222, 33,718]). The total number of these age positioned librarians are almost 2 times of the positioned librarians aged between 30-39. They are the main human force in the library.
There are 1,273 academic libraries that have submitted valid data on the total number of positioned librarians aged 50-59, of which 5.6% (5.9% in 2022) of them have no positioned librarians in this age group. Among the academic libraries that have submitted the data, the total percentage of positioned librarians aged 50-59 is at 39.5% (40.1% in 2022). The proportion of positioned librarians aged 50-59 is significantly lower than that of aged 40-49. In 2023, this ratio gap reached at 31.8%. This is due to the Chinese retirement system current being adopted. In China, female intermediate professional positioned librarians can retire at the age of 50. As the majority librarians in Chinese universities are female with intermediate professional titles, it means that most of them need to retire at 50.
The mean of the positioned librarians aged 50-59 is at 10.9 (11.7 in 2022), the median is at 7, the mode is at 2, the standard deviation is at 11.9, and the standard error of the mean is at 0.33. There are about 33,507 positioned librarians aged 50-59 in Chinese academic libraries (95% confidence interval [31,518, 35,496]). Almost 51.3% of Chinese academic libraries employ seven or more positioned librarians aged 50-59. An analysis of the collected data reveals that there are quite many senior and associate senior positioned librarians in Chinese academic libraries.
4.4.5. Basic Information of Non-positioned Employees
There are 1,298 academic libraries that have submitted valid data on contracted employees, with a total of 8,504 employees (8,491 in 2022). The mean of the contracted employee per library is at 6.6, the median is at 3 (3 in 2022), the mode is at 0 (0 in 2022), the standard deviation is at 10 (10 in 2022), and the standard error of the mean is at 0.28. Based on this, it can be estimated that the number of the contracted employees in Chinese academic libraries are at about 20,289 (95% confidence interval [18,602, 21,976]). From 2013 to 2022, the mean of the contracted employees was: 7, 7.7, 8.1, 7.5, 7.8, 6.5, 6.8, 6.9, 6.5 and 6.4 respectively. From the data above, it can be seen that the scale of contracted employees in the Chinese academic libraries is relatively small and the number of contracted employees has slightly increased.
There are 1,298 Chinese academic libraries that have submitted valid data on the employment of temporary workers, with a total of 4,110 people (4,498 in 2022). The mean of temporary workers is at 3.2 persons, the median and mode are both at 0, the standard deviation is at 8.2 persons, and the standard error of the mean is at 0.23 person. According to the mean, the number of temporary workers employed in the Chinese academic libraries is approximately at 9,837 persons (95% confidence interval [8,451, 11,223]). From 2014 to 2022, the mean of the temporary workers in the library was at 5.4, 4.8, 4.5, 4.5, 4.6, 3.8, 4.2, 3.6, 3.4 respectively. The mean of the temporary workers employed in the academic libraries in each year is lower than that of the contracted employees. In the past three years, the mean of the temporary workers has been close to half of that of the contracted employees. It shows a downward trend.
There are 1,298 Chinese academic libraries that have submitted valid data on part-time work-study students, with a total of 34,271 persons (33,522 in 2022). The mean is at 26.4 persons. From 2017 to 2022, the average number of part-time work-study students in the library are at 28.9, 27.9, 28.3, 25, 4.4, 25.3 respectively. The median is at 11 (10 in 2022), the mode is at 0, the standard deviation is at 49.9, and the standard error of the mean is at 1.38. All the descriptive statistics show that the number of part-time work-study students employed in the academic libraries varies from one library to another, with large disparities among them. The number of students employed by each academic library has slightly decreased in recent years.
The number of part-time students employed in the Chinese academic libraries is at about 81,154 (95% confidence interval [72,839, 89,469]). The number of students working as an assistant in academic libraries of different universities varies greatly, which is related to the library's labor demand, total human resources working ability, and employment policies. Overall, libraries in the Chinese "Double First-Class" universities can provide more positions for students working as an assistant than other universities.
4.5. Document Resources
4.5.1. Paper Literature Resources Utilization
There are 1,187 Chinese academic libraries that have submitted valid data on paper literature resources utilization (also books and periodicals loaned out) in 2023, with the mean of 45,000 volumes (42,000 volumes in 2022, 54,000 volumes in 2021, and 41,000 volumes in 2020), a median of 23,000 volumes (19,000 volumes in 2022), a mode of 1,500 volumes, a standard deviation of 65,000 volumes, and a standard error of the mean of 1,900 volumes. Both the mean and median have increased significantly compared with those in the previous year. This shows that the paper literature resources utilization in Chinese academic libraries is on the rise.
The total number of paper literature resources utilization in all the Chinese academic libraries is at about 138.33 millions (95% confidence interval [126.88 millions, 149.78 millions]). The top five academic libraries on paper literature resources utilization are Zhejiang University Library with 641,000 volumes (645,000 volumes in 2022), Peking University Library with 597,000 volumes (575,000 volumes in 2022), Shandong University Library with 526,000 volumes (499,000 volumes in 2022), Tsinghua University Library with 462,000 volumes (457,000 volumes in 2022), and Xiamen University Library with 425,000 volumes (403,000 volumes in 2022). The bottom five Chinese academic libraries in this regard are Shaanxi Post and Telecommunication College Library with 180 volumes (873 volumes in 2022), Shanxi Economic and Trade Career Academy Library with 178 volumes (110 volumes in 2022), Library of the Open University of Jilin with 150 volumes (150 volumes in 2022), Changchun Normal College Library with 134 volumes (missing in 2022), and Shanghai Maritime Academy Library with 113 volumes (130 volumes in 2022).
4.5.2. Literature Resources Collection
There are 1,208 academic libraries that have submitted valid data on the cumulative volume of paper books in their collections in 2023, with a mean of 1.428 million volumes (1.369 million volumes in 2022 and 1.315 million volumes in 2021), a median of 1.199 million volumes (1.157 million volumes in 2022), a mode of 250,000 volumes (533,000 volumes in 2022), a standard deviation of 1 million volumes (993,000 volumes in 2022), and a standard error of 28,800 volumes. Both the mean and median have been increased, and the cumulative volume of paper books has grown steadily.
There are very large gaps in paper literature resources collection between Chinese academic libraries. The range of paper literature collection are 8,366,909 volumes, the maximum and minimum of them are almost 160.7 times. The total paper literature collection in Chinese academic libraries is at approximately 4.39 billion volumes (95% confidence interval [4.216 billion volumes, 4.564 billion volumes]).
A rank analysis of the Chinese academic libraries in the paper literature collection volume is conducted. It shows that the top five Chinese academic libraries in this regard are Sun Yat-sen University Library with 8.419 million volumes (8.093 million volumes in 2022), Peking University Library with 7.441 million volumes (7.311 million volumes in 2022), Shandong University Library with 7.321 million volumes (7.08 million volumes in 2022), Nanjing University Library with 6.509 million volumes (6.403 million volumes in 2022), and Wuhan University Library with 6.04 million volumes (5.955 million volumes in 2022). The bottom five Chinese academic libraries are Tianjin City Vocational College Library with 82,162 volumes (missing in 2022), Changchun Institute of Education with 68,297 volumes (67425 volumes in 2022), Meihekou Kangmei Vocational and Technical College Library with 61,932 volumes (54617 volumes in 2022), Changchun Open University Library with 59,318 volumes (42,960 volumes in 2022), and Duke Kunshan University Library with 52,379 volumes (46295 volumes in 2022).
There are 294 Chinese academic libraries that have submitted valid data on the total amount of ancient books in 2023. The total amount of ancient books are about 14.429 million volumes (13.59 million volumes in 2022), and the mean is at about 49,100 volumes (46,500 in 2022 and 49,500 in 2021), the median is at 12,300, the mode is at 1, the standard deviation is at 11,800, and the standard error of the mean is at 6,900. An analysis of the collected data above shows that the volume of ancient books varies greatly across the Chinese academic libraries. Most of such libraries who own a large amount of ancient books are usually from Chinese “Double First-Class” universities.
Table 5 presents the distribution of the collection of ancient books in academic libraries in 2021-2023.
The rank analysis shows that the top five academic libraries on the total volume of ancient books are Peking University Library with 1.504 million volumes (1.504 million volumes in 2022), Renmin University of China Library with 418,000 volumes (418,000 volumes in 2022), Shandong University Library with 413,000 volumes (310,000 volumes in 2022), Beijing Normal University Library with 412,000 volumes (412,000 volumes in 2022), Nanjing University Library with 400,000 volumes (400,000 volumes in 2022), and Jilin University Library with 400,000 volumes (400,000 volumes in 2022).
Table 5. Distribution of ancient book collection in academic libraries from 2021 to 2023.
Collection (volumes) | Percentage (%) |
2021 | 2022 | 2023 |
1-999 | 11.6 | 9.5 | 12.2 |
1000-4999 | 17.8 | 21.6 | 20.1 |
5000-9999 | 11.6 | 12.5 | 11.9 |
10000-19999 | 18.3 | 18.1 | 16.7 |
20000-29999 | 10.0 | 9.9 | 10.2 |
30000-49999 | 10.4 | 9.9 | 9.9 |
50000-99999 | 5.4 | 5.2 | 4.7 |
100000-299999 | 11.2 | 9.9 | 10.6 |
Above 300000 | 3.7 | 3.4 | 3.7 |
There are 110 Chinese academic libraries that have submitted valid data on the total amount of non-book collection in 2023. The total amount of non-book collections in the Chinese academic libraries are at about 7.038 million items (8.042 million items in 2022). Each Chinese university owns 64,000 non-book collection (69,300 in 2022 and 70,900 in 2021), the median is at 13,500, the mode is at 2,000, the standard deviation is at 161,900 (179,400 in 2022), and the standard error of the mean is at 15,400. The data analysis result reveals that non-book collection is mainly managed by special academic libraries. The universities with strong architecture disciplines, for example, allow their libraries to collect more mapping collection than others. The universities with strong humanities and arts tend to invest more in the collection of manuscripts, calligraphy and painting materials.
Table 6 presents the distribution of the cumulative amount of non-book materials in Chinese academic libraries from 2021 to 2023.
Table 6. Distribution of non-book collections in Chinese academic library from 2021 to 2023.
Collections (item) | Percentage (%) |
2021 | 2022 | 2023 |
1-500 | 13.2 | 17.2 | 17.3 |
501-999 | 2.5 | 2.6 | 2.7 |
1000-4999 | 10.7 | 10.4 | 6.4 |
5000-9999 | 15.7 | 16.4 | 18.1 |
10000-49999 | 26.5 | 24.1 | 27.3 |
50000-99999 | 18.2 | 17.2 | 16.4 |
Above 100000 | 13.2 | 12.1 | 11.8 |